Take a closer look at our
case studies to see how we’re
creating positive change
Safe streets:
Redefining Public safety for Women in LA

Safe Streets: Journey Map
Dive into the world of Emma, our everyday Angeleno.
Across five distinct stages, join her as she juggles routine tasks and unexpected challenges.
As you journey with Emma, observe:
Overarching Actions: These are the broad, guiding decisions and behaviors Emma consistently takes in response to her environment, setting the tone for her daily journey.
Digital Interactions: Observe the pivotal role technology plays in her life, guiding, assisting, and sometimes misdirecting her.
Physical Journey: The tangible routes and spaces Emma traverses throughout her day, highlighting her interactions with the environment around her.
Ulterior Motives: Beyond her daily goals, uncover the deeper objectives that propel her forward, her hidden aspirations amidst the concrete jungle.
Pain Points: Feel the friction and challenges Emma faces, the hurdles that sometimes threaten to hold her back.
Opportunities for Intervention: Identify moments where a slight change or intervention could drastically shift Emma's experience for the better.
Daily Decisions: Witness the choices she makes, influenced by an environment colored by crime.
-
Urban environments like Downtown and Koreatown Los Angeles, embody the delicate balance required to ensure public safety.
These area’s challenges are underlined by a host of factors including aging public infrastructure, social-cultural dynamics, and the pressures brought on by high population density.
In particular, these challenges have had a disproportionate impact on women.
To clarify the factors contributing to public safety challenges, a closer look reveals:Poor infrastructure: Urban areas may suffer from a lack of fundamental amenities such as well-lit pathways, universally accessible sidewalks, and safe pedestrian crossings. Such deficiencies in the built environment can foster a sense of insecurity, particularly during evening hours.
Sociocultural Dimensions: The urban landscape often reflects deeper social inequalities, including poverty, homelessness, unemployment, and criminal activities. These conditions form a complex web of challenges that permeate feelings of unease and insecurity within the community.
Population Density and Spatial Constraints: The compactness of urban areas, with their high concentration of inhabitants, can exacerbate feelings of overcrowding and personal safety concerns. Spatial planning must acknowledge these pressures to create environments that promote individual comfort and community well-being.
Addressing the multi-dimensional nature of public safety in urban environments calls for a holistic approach. The present case study represents a concerted effort to integrate the principles of urban planning and human-centered design with insights from criminology, and public policy.
Through this investigation, we aim to amplify and put forth actionable strategies to enhance the safety of women in urban environments similar to downtown Los Angeles, California. -
At the core of this case study are practical methods to improve public safety in urban areas. Our goal is to encourage teamwork between city planners, community members, and local government to make decisions together. This ensures that municipal planning strategies resonate with and cater to the unique identities and needs of the communities they serve. We embrace an approach known in the field as "tactical urbanism.”
Tactical Urbanism is a city and citizen-led approach to neighborhood building using short-term, low-cost, scalable interventions designed to effect an immediate change. It empowers individuals and communities to make meaningful changes within their neighborhoods. These initiatives could include pop-up parks, street furniture, community art installations, and more.
Our case study leverages this ethos of tactical urbanism as a conduit for civic engagement, thereby democratizing the urban development process. This enables professionals from various fields to contribute their specialized skills for the betterment of the local community. Our defined objectives articulate this approach:
Data-Driven Analysis
Engage in routine scrutiny of city open data sets, focusing on those variables that influence the living conditions of urban residents. This analysis helps identify trends and areas that require attention.
Community-Centric Artifacts
Develop interactive tools like user journey maps and data dashboards designed to be easily understood and utilized by community members and local officials alike. These serve as communal touchpoints, bridging the gap between technical planning and public understanding.
Communication and Recommendations
Produce regular insights and practical recommendations derived from our case studies for the city's decision-makers. These findings aim to inform and guide public policy.
Community Collaboration
Highlight and connect with community organizations actively working within urban development, fostering an environment of shared knowledge and collaboration. By breaking down silos, we enable a more seamless flow of information and ideas.
By adopting these objectives, we position our case study as a practical and inclusive framework for urban improvement, aligning with the principles of tactical urbanism, and emphasizing the value of community-driven planning. -
Primary Research
Social Channels Analysis: Analyzing social channels specifically focused on women's public safety.Surveys: Utilizing tools like Typeform to gather insights from the public.
Interviews: Interviewing friends and family members who have experienced the designated hotspot areas of Downtown Los Angeles.
Historical and News Analysis: Analyzing Los Angeles news and historical events involving crime in our designated hotspot areas.
UX Design/Research
User Personas: Develop user personas based on real-world complaints and data. These personas should represent a range of stakeholders who navigate Downtown Los Angeles.
User Journey Mapping: Create detailed user journey maps that highlight the experiences, pain points, opportunities, and moments that matter for each persona.
Feedback Iterations: Work in collaboration with local municipalities to ensure accuracy.
Data AnalysisData Collection & Review: Understanding the provided urban data and real-world complaints.
Data Cleaning & Preprocessing: Preparing the data for analysis.
Data Analysis: Using tools like SQL & machine learning clustering to identify patterns and inefficiencies in city-provided data.
Data Visualization: Creating visual representations of our findings. -
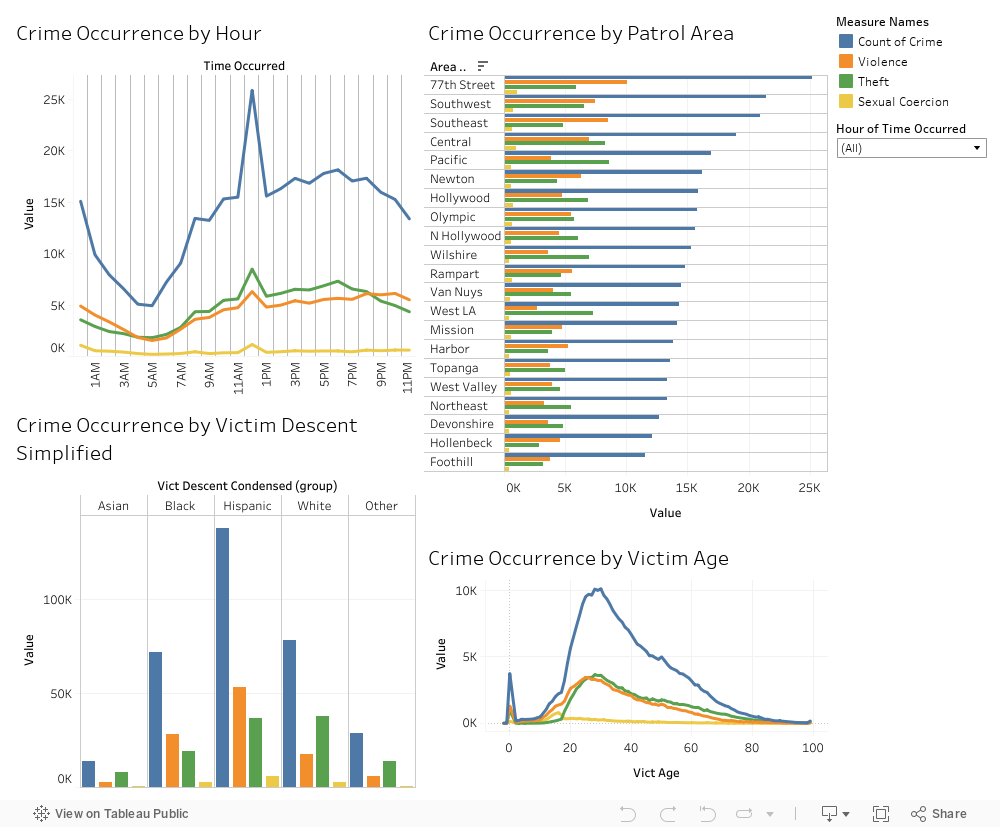
Hotspots Identified
Using Los Angeles crime data spanning 2020 to the present, we were able to identify numerous crime hot spots around Los Angeles. To emphasize the real-world implications of these hotspots on everyday life, we've created a user journey map and overlaid our persona's daily commute route to and from work across these areas.
Violent Crime Metrics
Despite a city-wide dip in violent crime rates over a span of ten years, Black women's exposure to violence hasn’t budged.Black women, representing just 4.3% of Los Angeles' populace, disturbingly make up a significant chunk (25%-33%) of female violence victims.
Socioeconomic Factors
Communities with higher poverty, unemployment, and environmental hazards face higher rates of violence against women.
The city has an opportunity to improve these conditions through upward mobility programming, economic opportunities, social safety net programs, and support for living wages and quality-of-life policies.
Data Gaps and Challenges in Understanding Violence Trends
Gaps in data collection obscure trends in violence against Angelenos with intersecting identities, such as transgender or non-binary individuals.
Issues like housing instability, lack of digital access, and reliance on Black women as primary economic providers further confound and increase the risk of violence.
Difficulty in employing an intersectional lens in data analysis, such as capturing multiple biases in hate crime data, limits accurate understanding.
Domestic Violence (DV) Statistics
From January 2011 through August 2022, there were 175,624 total DV victims in Los Angeles; 79% were female.
Black women accounted for 23.12% of all DV victims and 29.37% of female DV victims, Hispanic women accounted for 50.5%, while white non-Hispanic women were only 12.7%.LAPD's Approach to Cases
Cases are not prioritized based on the victim's race, gender, or identity, in line with California Proposition 209
Data sets have to be assembled manually by officers, causing delays and a potential lack of awareness of issues impacting women of color.
Rising Violent Crime in Public Transportation
Violent crime on Metro trains, buses, and stations has risen by 14% to 16% higher than pre-pandemic levels.
Aggravated assaults on Metro buses increased by 88.9% in early 2021 compared to 2020 and 209.1% compared to 2019.
Some metro stations, like MacArthur Park/Westlake, have seen elevated crime rates related to nearby open-air drug markets.
Analysis of Crime Types and Locations
Criminal threats with no weapons were the most prominent crime, and 67% of the top 12 crimes were non-violent.
High concentrations of crime were found around metro and bus stations, a critical consideration for public safety and future events like the Olympics. -
Following our discoveries, it is clear that funding, resource management as well as innovations to galvanize community involvement are needed.
Upcoming Public InterventionsTBR is set to launch public interventions at metro stations and identified crime hotspots, enabling live polling for everyone. Our top priority is transparency. We're actively working on methods to provide real-time data seamlessly. Additionally, our aim is to collect public feedback in ways that empower individuals rather than causing anxiety.
-
🔄 On-Going
The study is actively progressing with continuous data collection and analysis. We are now in the phase of developing an interactive tool to visualize the data and engage stakeholders. -
We're assembling a dream team ⚡️ If your skills match the criteria below, we want you on board!
UX Designer 🧑🏾🏫
AR Engineer / AR App Developer 👨🏻💻
User Researcher 👩🏫
Data Scientist 👩🏻🔬
Architect / Urban Planner 👨🏼🏫
Community Leader 👨🏿💼
Collaborate
Join our multi-disciplinary team to enrich the study with diverse insights.
Share Knowledge
Contribute your expertise in data analysis, urban planning, or user experience design.
Drive Innovation for Quality of Life
Engage in building and researching solutions to problems that affect our day-to-day lives.
Hone your skills with portfolio work using real data, and be at the forefront of creating meaningful change.
DATA OVERVIEW
Delve into our Tableau dashboard created by volunteer data scientist, Luke Sonnanburg. We've provided key data points to shed light on the patterns of crime
in Los Angeles from 2020 to Present Day.